Real Time Rome
A portrait of Rome through the lens of mobile data, mapping real-time urban life from pulse to traffic, tourism to celebration.
Real Time Rome visualizes the dynamics of urban life using real-time data collected at an unprecedented scale from mobile phones (Telecom Italia) and other wireless systems (ATAC, City of Rome). The project offers a unique glimpse into how ubiquitous connectivity reshapes our understanding of the modern city.
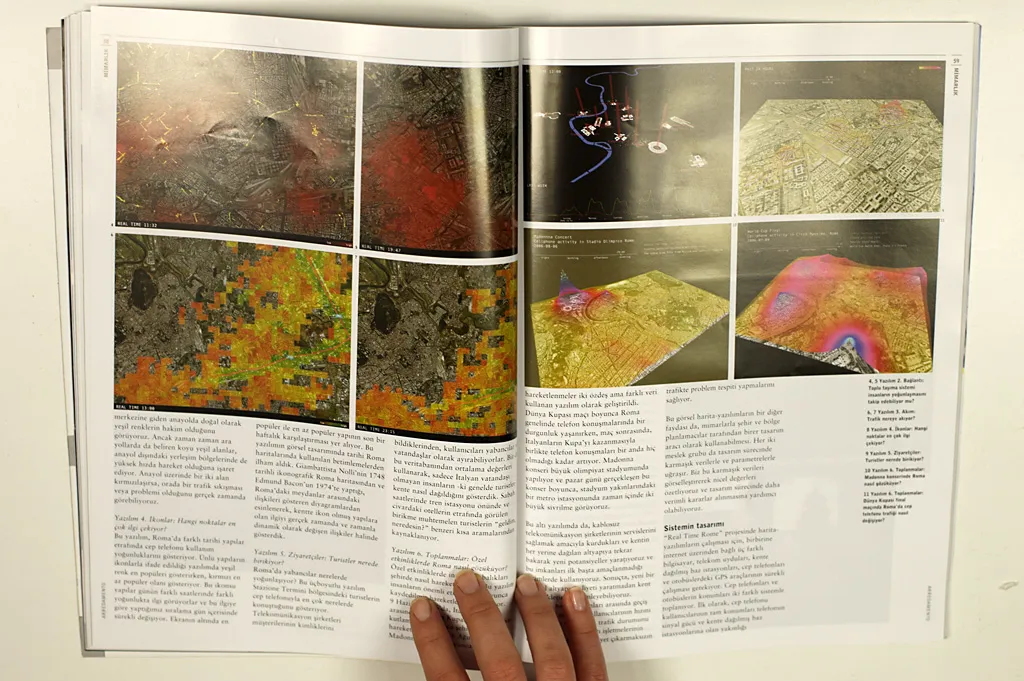
Six live software-generated maps translate mobile phone signals into visual narratives of the city:
-
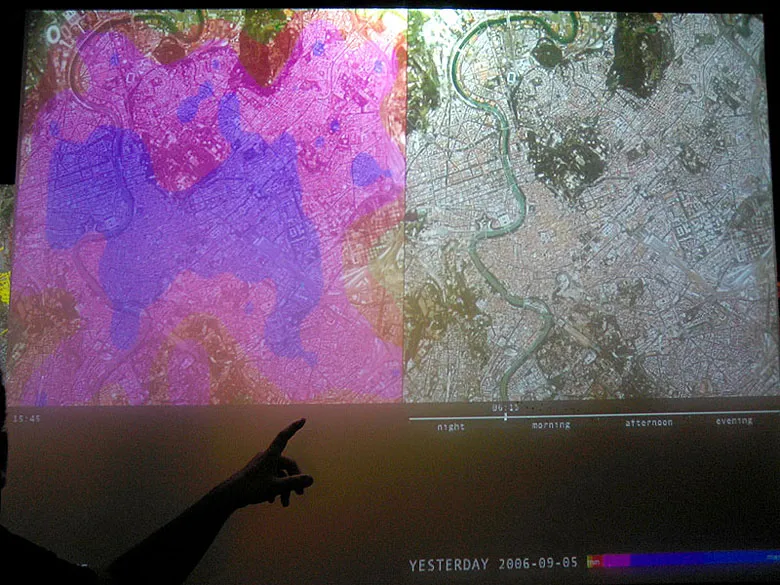
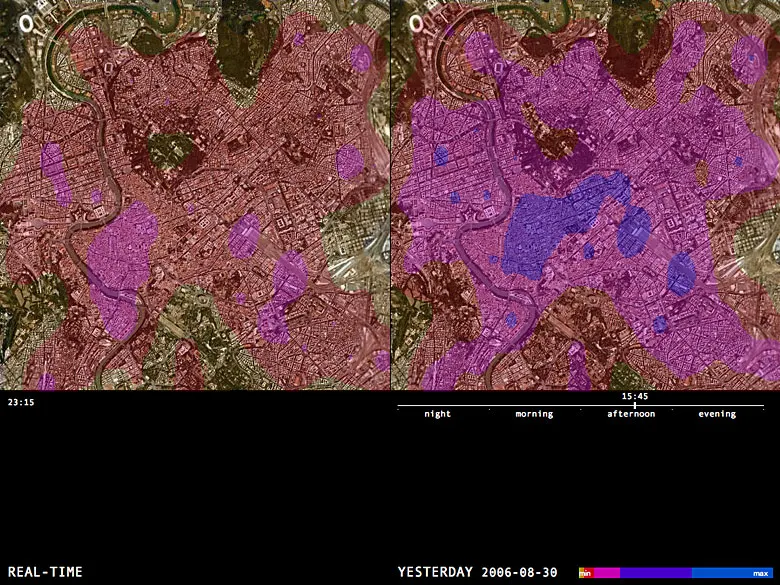
Pulse – What are the patterns of use in Rome?
Visualizes the intensity of mobile phone calls across the city in real time and compares them with patterns from previous days to show where people are converging. -
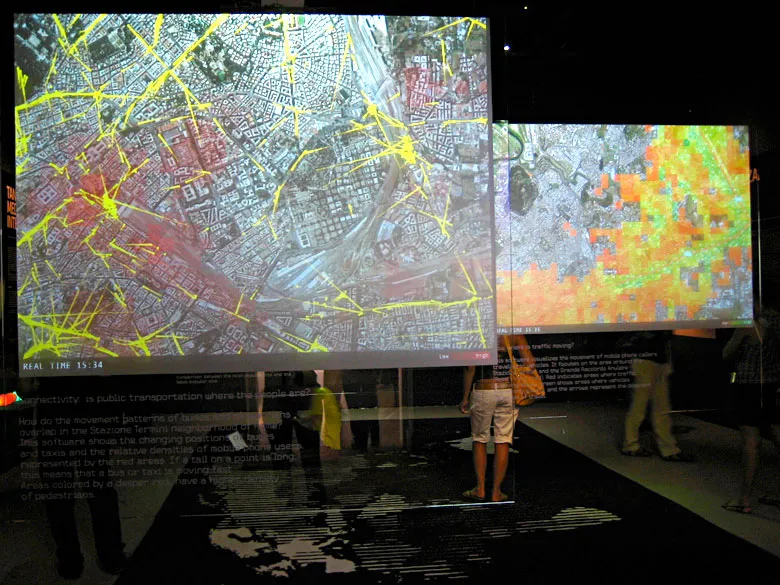
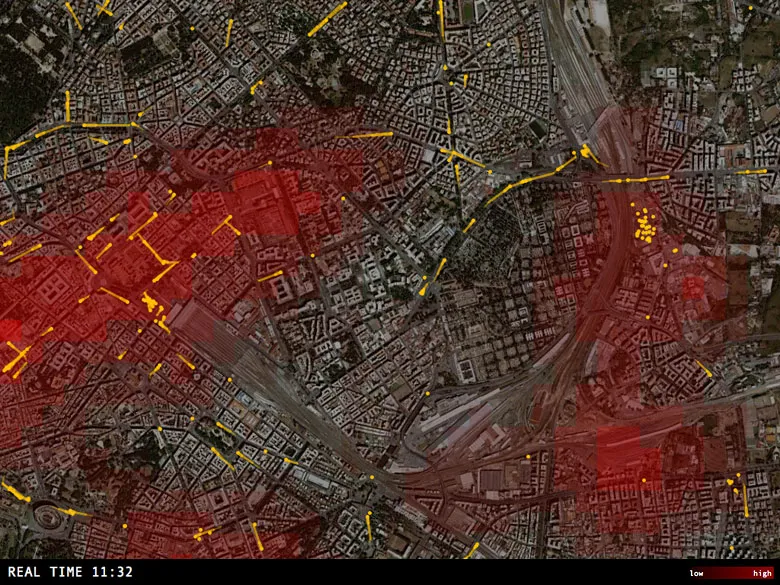
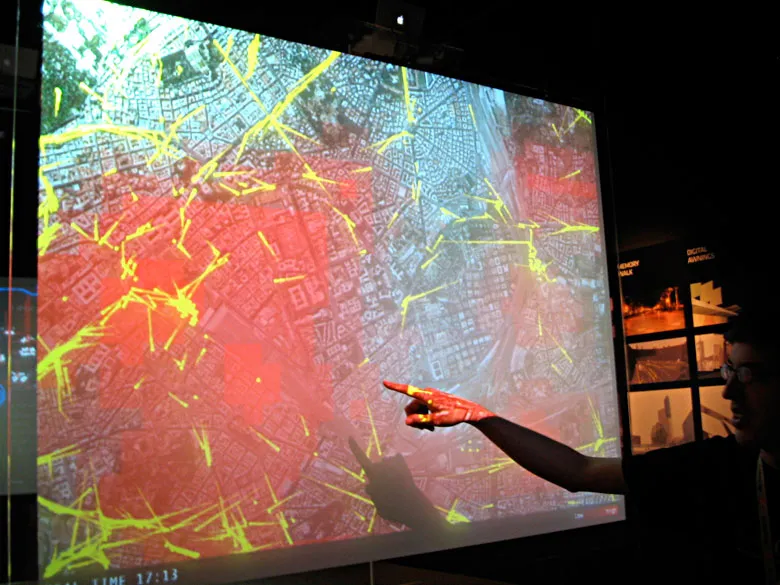
Connectivity – Is public transportation where the people are?
Overlays ATAC bus movements (yellow points) with pedestrian density (red areas) in the Stazione Termini neighborhood. Long tails on yellow points indicate faster-moving buses. -
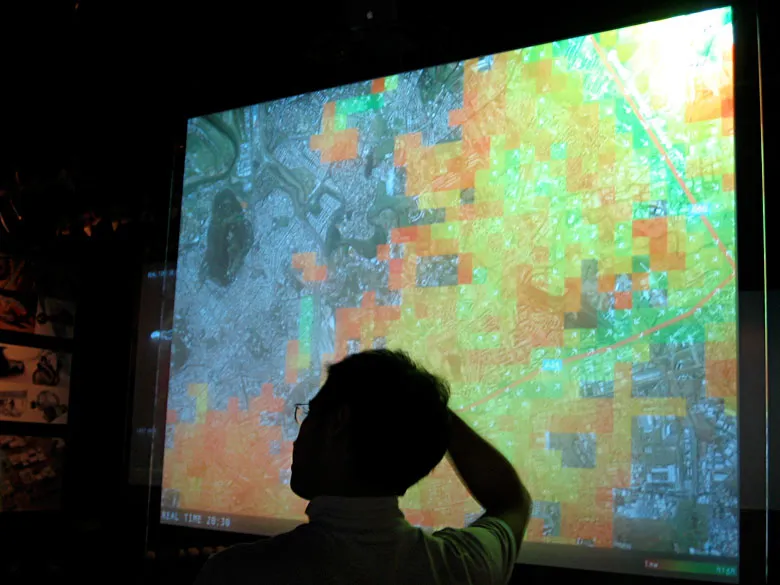
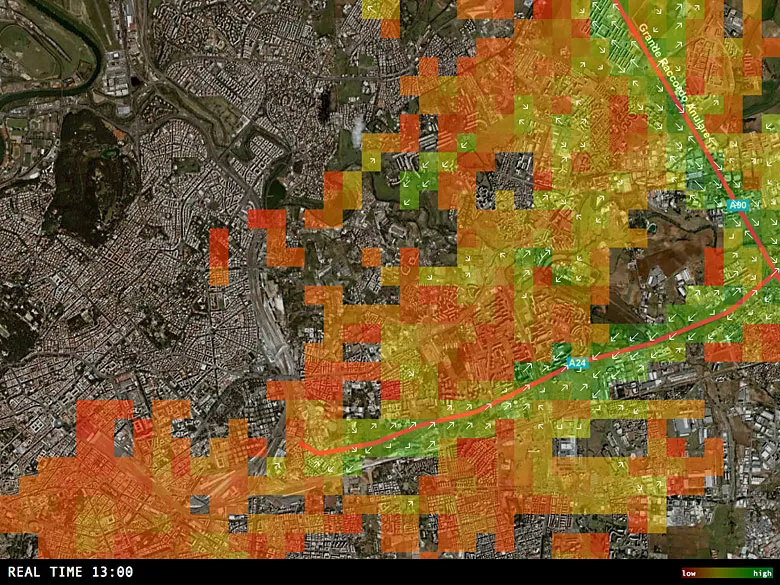
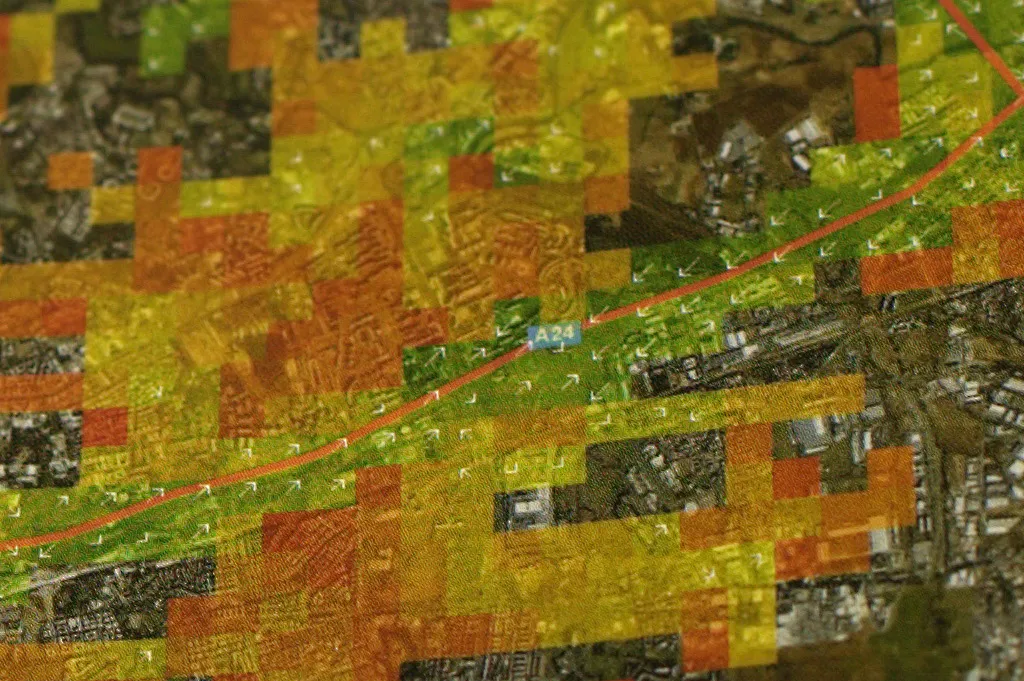
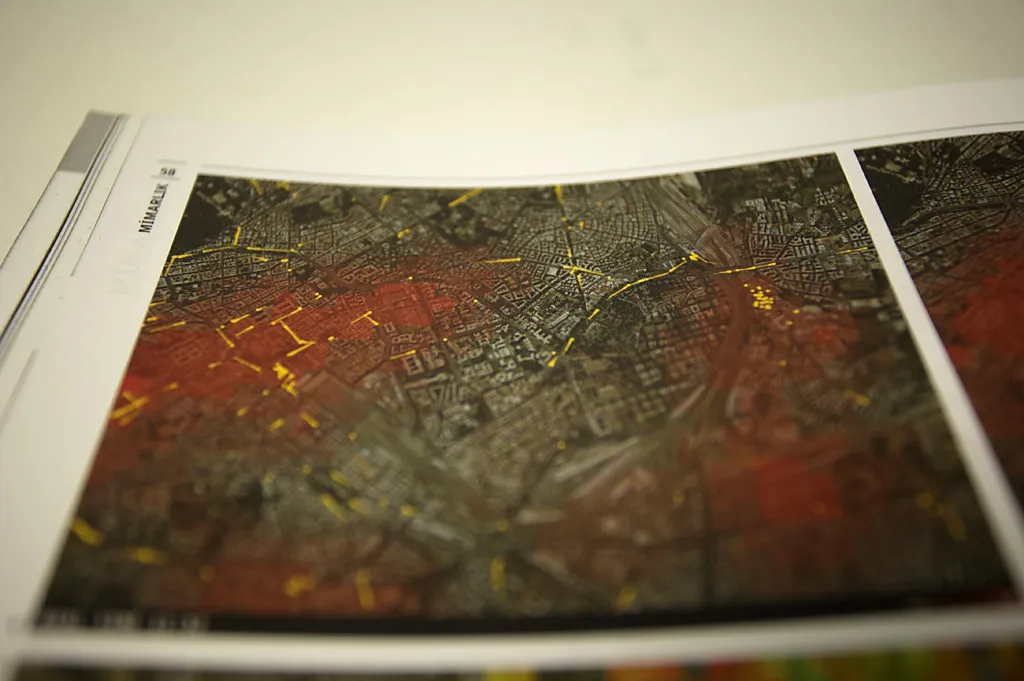
Flow – Where is traffic moving?
Maps mobile phone users traveling by vehicle to reveal traffic conditions. Red areas show congestion, green indicates smooth flow, and arrows represent direction of travel. -
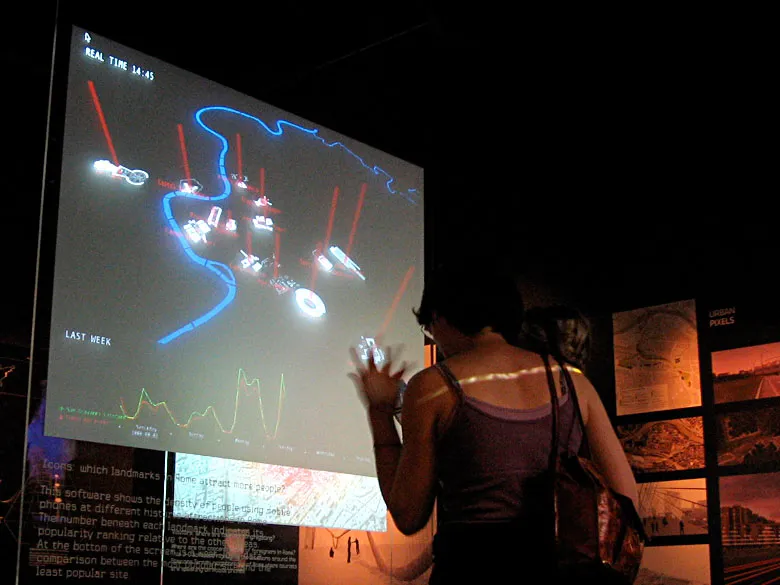
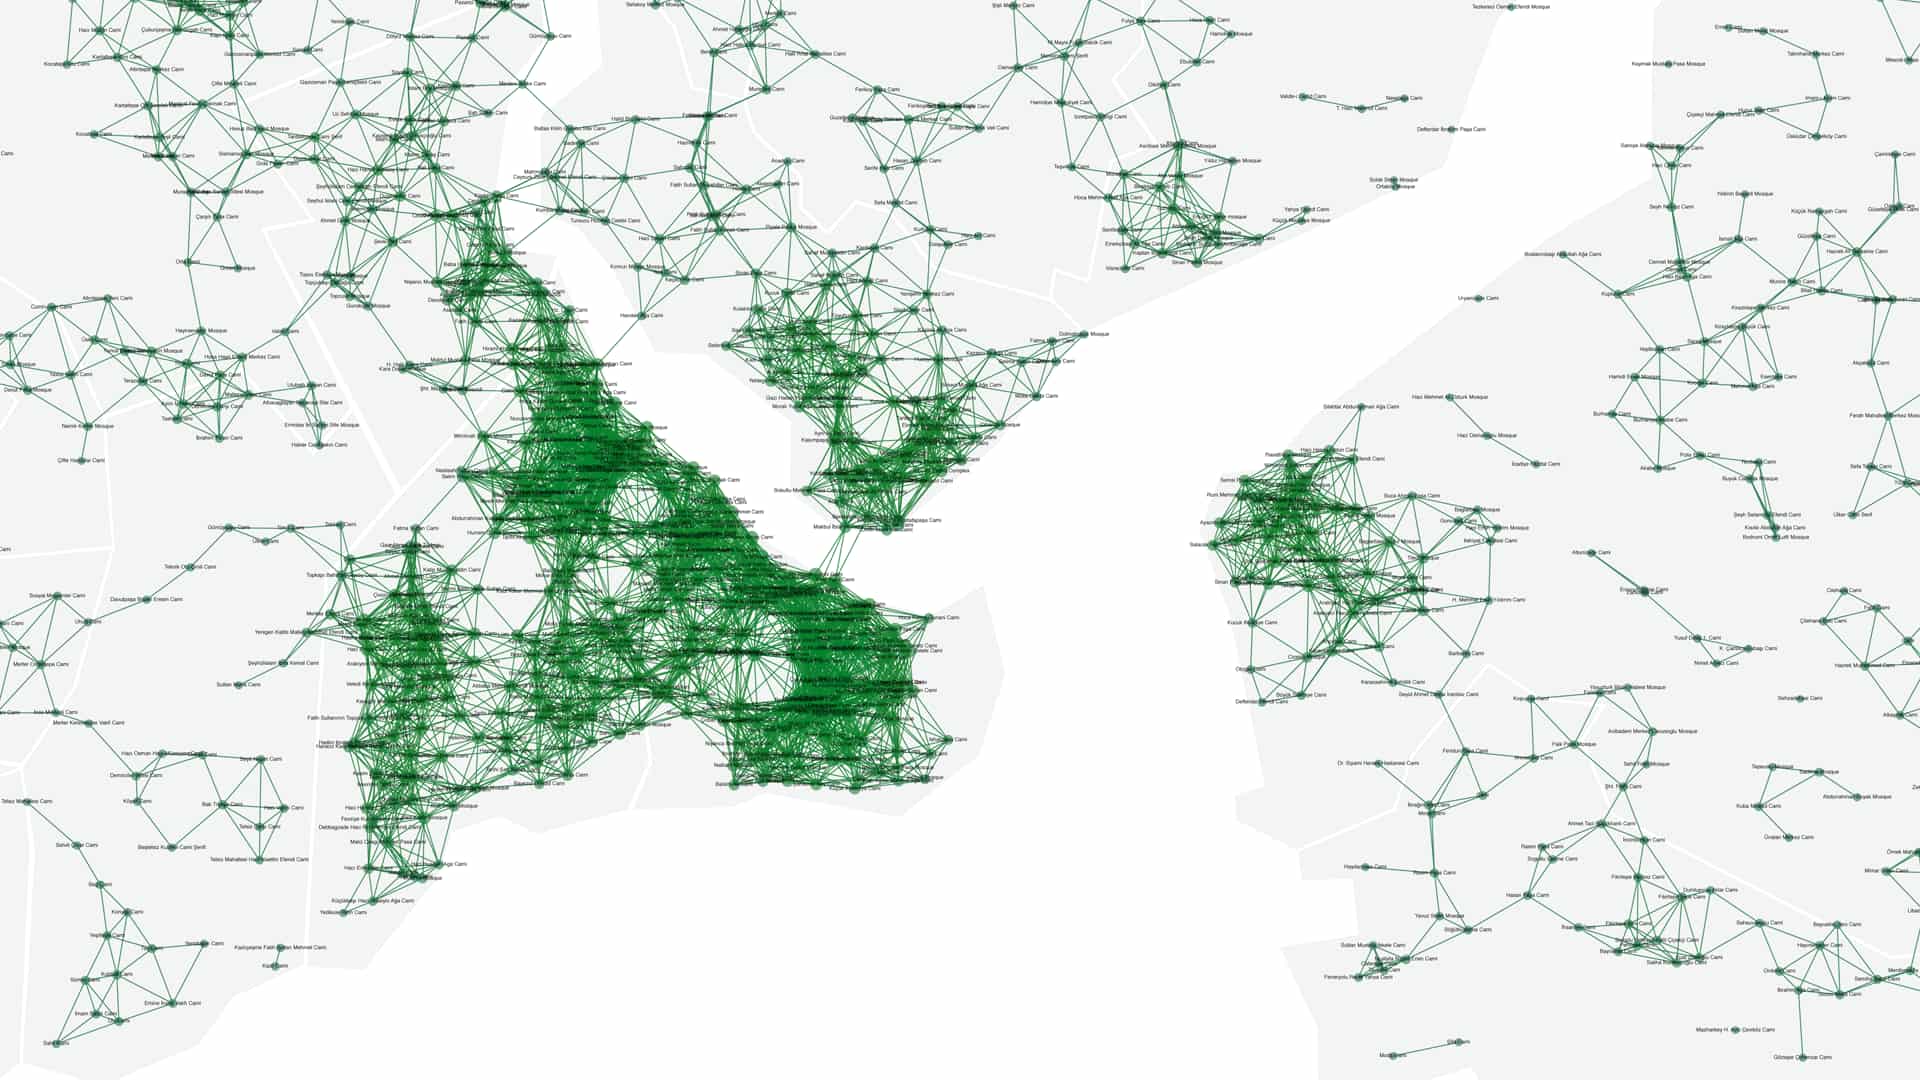
Icons – Which landmarks in Rome attract more people?
Ranks major landmarks based on mobile phone density. Green marks the most visited, red the least. A graph at the bottom of the screen compares site popularity over a week. -
Visitors – Where are tourists congregating?
A 3D map identifies areas with high densities of foreign mobile phone users, especially around Stazione Termini. -
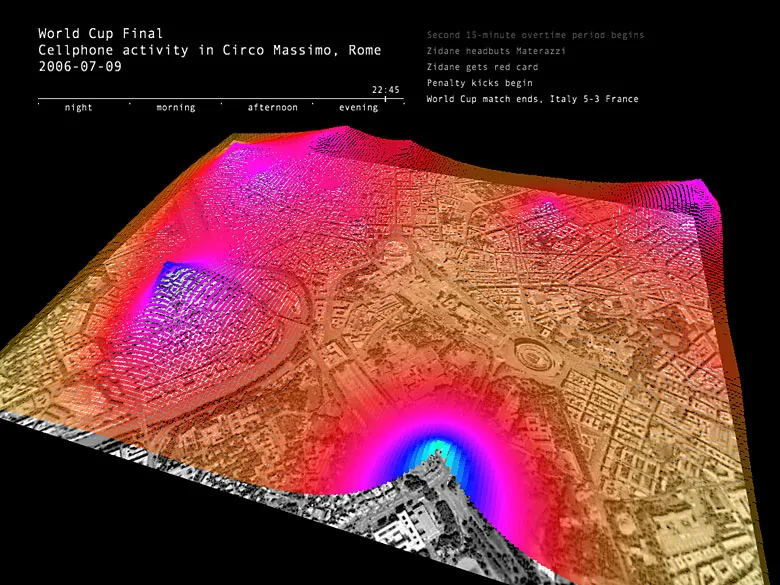
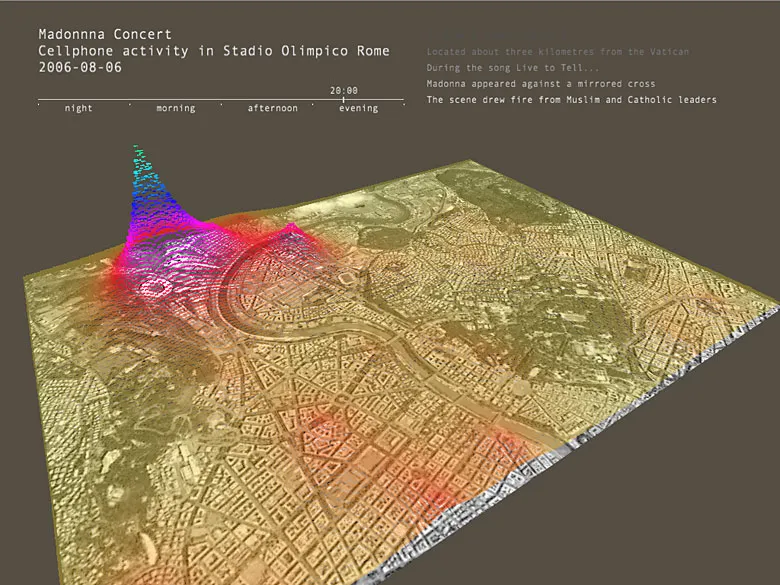
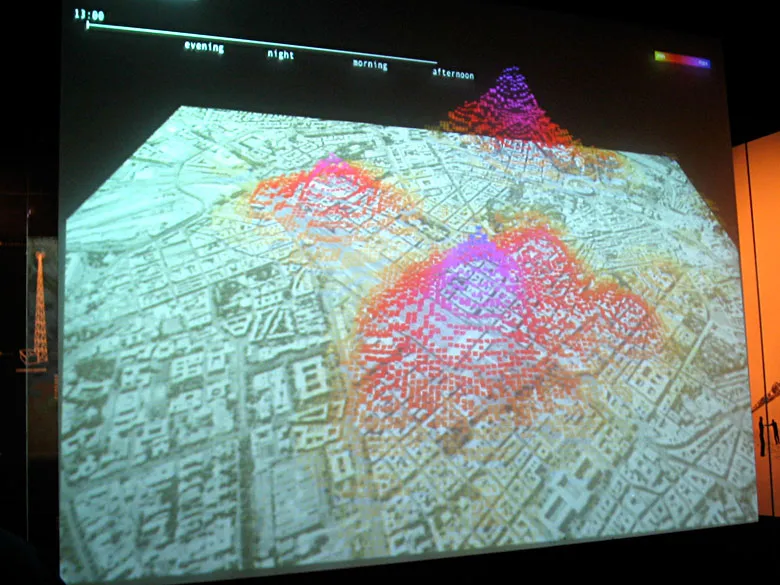
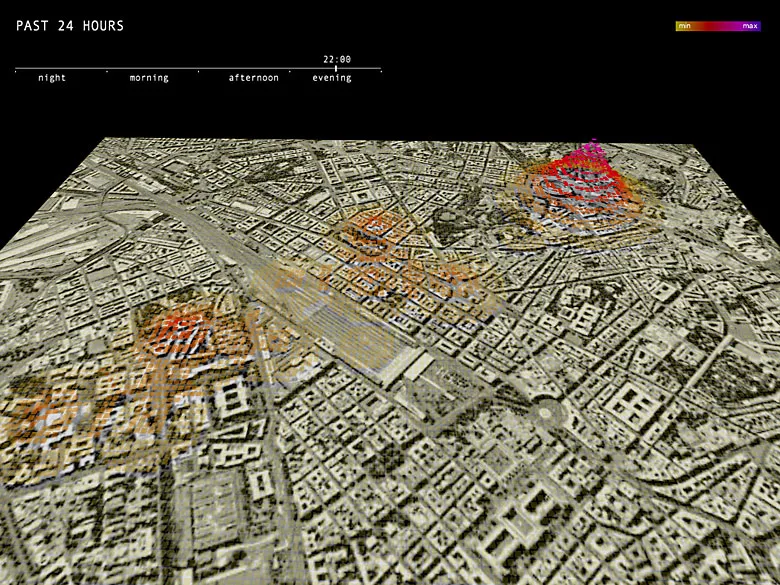
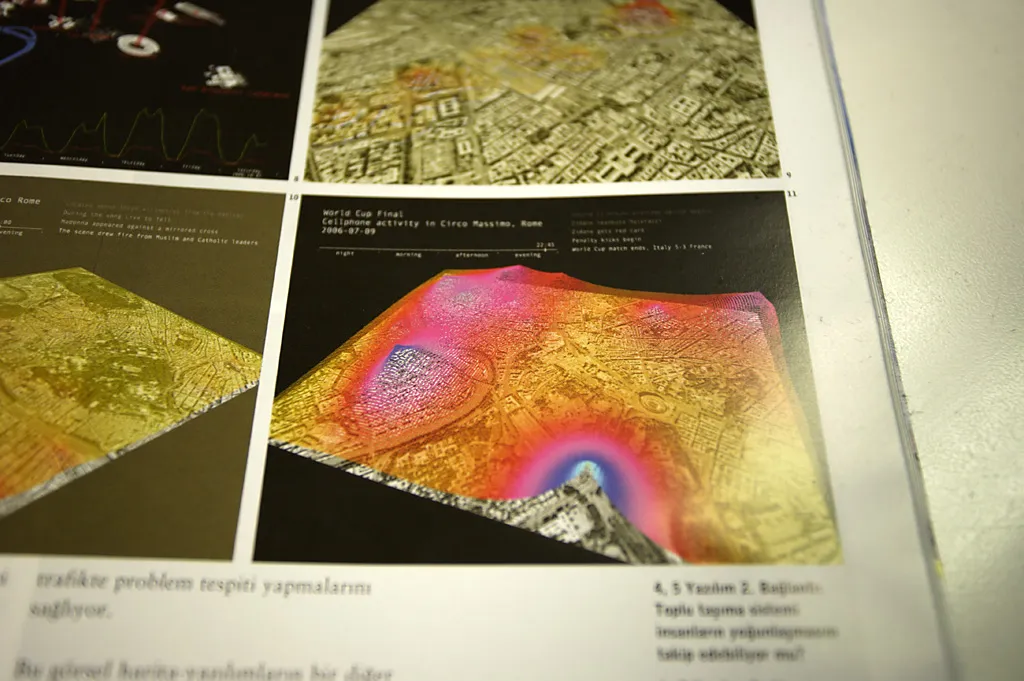
Gatherings – What does Rome look like during special events?
Tracks how crowds occupy and move through the city during major events, such as: The 2006 World Cup Final and celebrations the following day; Madonna’s concert in Stadio Olimpico Rome on August 6, 2006.
Real Time Rome was created at the MIT Senseable City Lab.
Collaborators
Exhibitions