From Network Diagram to Structured Text


A network diagram, or a graph, can be represented as text in many ways. We want it to be a structured text so that it can be read by computers. A graph is a set of objects called nodes or vertices connected by links called lines or edges depending on the context (physics, computer science, sociology etc.). The diagrams above are different examples of graphs. A basic representation of links between nodes could be written in this way:
john -> brent
brent -> amber
amber -> john
As you can tell this is a three person social triangle. The widely used graph visualization tool Graphviz uses this syntax, called the DOT language, to represent the basic network data (with semicolons at the end of each line). The DOT language can get quite complex for representing more detailed attributes of graphs.
In our Creative Networking course we started to draw imaginary network diagrams first by hand (see images from earlier workshops), then this week, we will translate them to structured text. We will use an XML file format called GraphML to represent the graph in text. We use this XML structure because it is web friendly, emerged as a standard by many contributions, easy to share, aka the ultimate man-machine readable data format.
GraphML is an easy-to-use XML format for graphs. It consists of a language core to describe the structural properties of a graph. Since it is XML, quite flexible for your application-specific needs. Its main features include support for directed, undirected, hierarchical and mixed graphs, also references to external data. Here is the graph above in basic GraphML:
<graph id="G">
    <edge source="john" target="brent">
    <edge source="brent" target="amber">
    <edge source="amber" target="john">
</graph>
We use XML-attributes (source=“something”, id=“1”, directed=“true” etc.) to declare graph properties such as directed, undirected, weight, or ID. To store extra data in the nodes and edges we use nested XML. Extra data declarations are called GraphML-attributes, which are defined with the <edge> tag. Also we can declare parser info for optimized parsing. You can learn more about GraphML, see how to, and examples here in GraphML Primer and GraphML Specification.
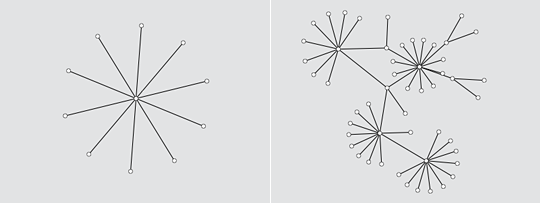
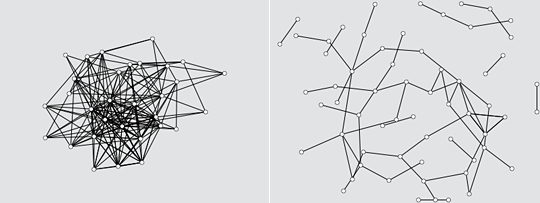
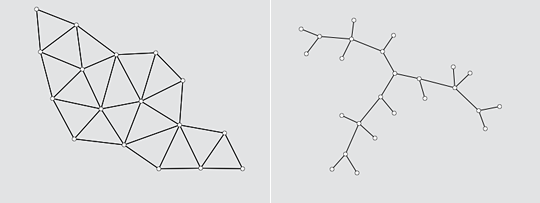
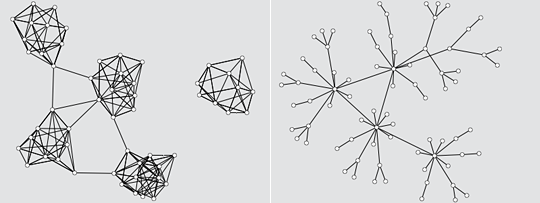
This week at the Creative Networking class we will study network topologies. That is the study of the arrangement or mapping of the elements (nodes, edges, etc.) of a network. I manually prepared GraphML data for each type of network topology that we will cover in the class. These images below are prepared by the Processing program that I prepared as a template for this class (will post it tomorrow after I clean it up the code). You can also grab the printable PDF version of the diagrams below.
Centralized, Decentralized

Centralized that is all nodes connect to a single node, a hub. It is hierarchical. Single authority. No cross-linking on the periphery nodes. Decentralized network is the multiplication of centralized networks. Many hubs, each with its own dependent nodes.
Distributed, Tree

A distributed network has no central hubs. It is a mesh. Every node is autonomous. Multiple routes to go from one node to the other. A tree is obviously hierarchical, each node has multiple children, but only one parent. No cross-linking between branches.
Dense, Sparse

Highly connected v. loosely connected.
Core-periphery, Fully Connected

Core-periphery networks are highly interconnected in the middle and sparse on the edges, few connections from periphery to the core. In a fully connected all the nodes connected to every other node. My friend Ali Miharbi once said that a football team’s 11 members during a match can be considered as a fully connected network.
”Small World”, “Scale-Free”

Social network analyst Stanley Milgram coined the term Small World to describe tight clusters connected to other clusters with a few bridges. Scale-free network as defined by Albert-László Barabási, is the network whose degree distribution follows a power law. In such networks few nodes have large number of connections, some nodes have moderate connectivity, and many nodes have very few connections.
The relationship between form and text in art today somehow inherit in the relationship between data and code. When the data is relational so that it makes a graph, how do we approach it in the context of the arts? This is what we study in the Creative Networking course.
View more posts in the Blog Archive.